

ECG data analysis on the intervals each monitor reports
An electrocardiogram (ECG) monitor or patch measures its own intervals from the trace: PR, QRS, QT and the corrected QT (QTc). Kymolog records each interval it reports as a coded value in milliseconds, with the heart rate and rhythm label beside it.
QTc · LOINC 8636-3 · ms · FHIR R4


Intervals in milliseconds, each with its own code
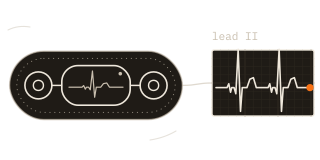
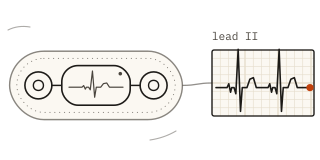
At 08:05 a monitor at bed W1-4 reports QTc 438 ms, QT 400, PR 160, QRS 92 and a heart rate of 72. The Kymolog™ edge agent files them as one panel in FHIR R4 (Fast Healthcare Interoperability Resources, release 4). Each interval is a coded component of that panel.
QTc carries LOINC 8636-3, Q-T interval corrected, and the uncorrected QT carries 8634-8, so the two never share a row. The correction formula is the monitor's setting; Kymolog stores the QTc it reports beside the QT and heart rate it came from. The panel also carries the rhythm label, such as atrial fibrillation.
Bedside monitors and wearable patches report through the same mapping. A patch measures its intervals from the few leads it records, not from a 12-lead ECG, and Kymolog files them under the same codes.
Example reading: QTc 438 ms
Figure 2 as a table
| Interval | LOINC | Long name | Value | UCUM unit |
|---|---|---|---|---|
| QTc | 8636-3 | Q-T interval corrected | 438 | ms |
| QT | 8634-8 | Q-T interval | 400 | ms |
| PR | 8625-6 | P-R Interval | 160 | ms |
| QRS | 8633-0 | QRS duration | 92 | ms |
| Heart rate | 8867-4 | Heart rate | 72 | /min |
ECG intervals into the EHR
Before each dose of a QT-prolonging drug, a telemetry nurse measures QT with calipers on a printed strip and types the number into the flowsheet. Kymolog files the monitor's own intervals instead. It finds the patient from the bed, applies the review step set for ECG monitors, and splits the panel into one result per interval.
ECG integration of this kind puts the numbers clinicians act on into the chart, each in its own flowsheet row with its time. Results reach the seven EHRs we deliver to as FHIR R4 Observations or HL7 v2 ORU messages.
Figure 3 as a table
| Interval | LOINC | Unit | 07:05 | 08:05 |
|---|---|---|---|---|
| QTc | 8636-3 | ms | 430 | 438 |
| QT | 8634-8 | ms | 398 | 400 |
| PR | 8625-6 | ms | 162 | 160 |
| QRS | 8633-0 | ms | 90 | 92 |
| Heart rate | 8867-4 | /min | 70 | 72 |
Bring the monitor class your telemetry unit uses and the EHR it charts in. The demo splits one ECG panel into interval rows in a test chart.
Request a demoQTc monitoring from coded intervals
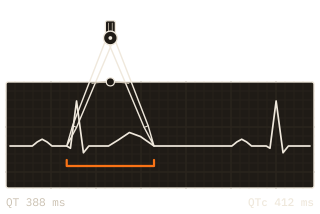
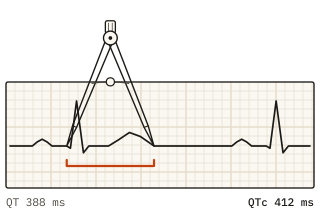
Clinicians and studies read QTc as a change from the patient's own earlier values. Each QTc Kymolog files keeps its measurement time and its device. Readings such as 430 ms at 07:05 and 438 ms at 08:05 then stay in order across a shift on telemetry or the visits of a trial.
Kymolog stores the uncorrected QT and the heart rate beside each QTc. A study that prefers another correction formula can recompute QTc from those two values, and every result still points back to the monitor that measured it.
ECG intervals for research
Every interval Kymolog files for the chart is also kept as a study row. The row holds the value, its LOINC code and the time the monitor measured it. It also names the encounter and the monitor, by serial number and by unique device identifier (UDI).
ECG clinical trials and drug-safety studies need that link from each QTc to a device and a time. Rhythm labels sit on the same rows, so an analysis can set aside hours of atrial fibrillation before it averages anything. Medication orders and diagnoses come from the EHR itself; Clinical Extract covers that side of a study.
Set up an ECG demo for your telemetry unit
Tell us which ECG monitors or patches your units use and which EHR they chart to. We will follow one QTc from the monitor to a flowsheet row and into a dataset. We reply within one business day with times to talk.