

CGM data analysis from readings coded at capture
A continuous glucose monitor (CGM) on a 5-minute cycle sends 288 glucose values a day. Kymolog codes each one under LOINC 99504‑3, in mg/dL, as it arrives, so the flowsheet and a 14-day study series start from identical values.
LOINC 99504-3 · mg/dL · every 5 minutes · FHIR R4
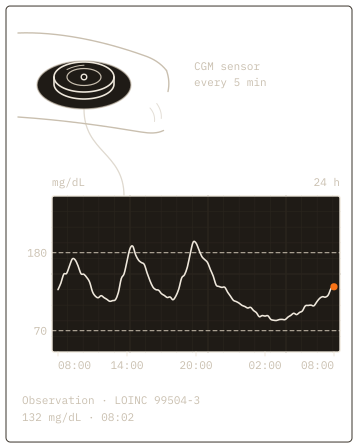
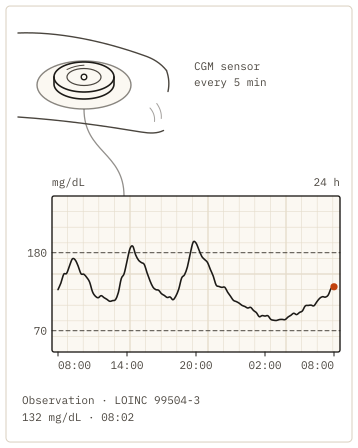
A CGM reading, before and after coding
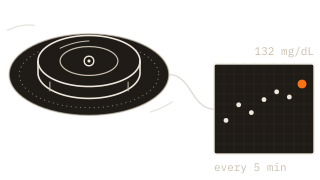
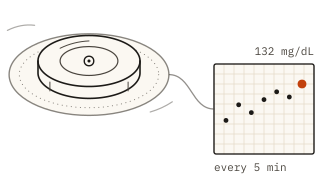
At 08:05 the sensor reports 142, the unit mg/dL and its serial number, and nothing else. The Kymolog™ edge agent codes the reading as an Observation, the record that Fast Healthcare Interoperability Resources (FHIR) keeps for one measurement, under LOINC 99504-3: glucose in interstitial fluid.
The code specifies the fluid because a sensor reads glucose in the fluid under the skin. A blood code such as 2339-0 would file CGM values beside meter and lab results. Kymolog also keeps the trend arrow and any high or low alarm the sensor reports on the same Observation.
Example reading: glucose 142 mg/dL
Figure 2 as a table
| Field | Filed as | From the sensor |
|---|---|---|
| code | LOINC 99504-3, glucose in interstitial fluid | nothing: Kymolog adds it |
| valueQuantity.value | 142 | glucose 142 |
| valueQuantity.code | mg/dL, a UCUM code | units mg/dL |
| effectiveDateTime | 2026-10-03T08:05:00-04:00 | time 08:05:00 |
| device | Device/cgm-7f3a | serial 7F3A0219 |
| subject | Patient/p-041 | nothing: Kymolog adds it from the device's assignment |
CGM data into the EHR
On an insulin protocol, a nurse reads the CGM receiver every hour and types the value into the flowsheet. With Kymolog, each reading reaches the patient's flowsheet on its own, at the sensor's measurement time.
CGM integration has the same per-device-type setting as every other class: a hospital sends CGM readings straight to the chart, or holds each one for a nurse to approve first. Readings reach Epic, Oracle Health (Cerner), MEDITECH, athenahealth, eClinicalWorks, NextGen and Veradigm over FHIR R4 or HL7 v2, as each EHR takes them.
Figure 3 as a table
| Time | Value (mg/dL) | Into the EHR | For research |
|---|---|---|---|
| 07:50 | 126 | flowsheet value, Glucose (CGM) | dataset row: p-041, 99504-3, Device/cgm-7f3a |
| 07:55 | 131 | flowsheet value, Glucose (CGM) | dataset row: p-041, 99504-3, Device/cgm-7f3a |
| 08:00 | 137 | flowsheet value, Glucose (CGM) | dataset row: p-041, 99504-3, Device/cgm-7f3a |
| 08:05 | 142 | flowsheet value, Glucose (CGM) | dataset row: p-041, 99504-3, Device/cgm-7f3a |
Name the EHR your wards chart in and how often your sensors report. The demo files a day of CGM readings into a test flowsheet and opens the same series as study rows.
Request a demoCGM in the hospital
Bedside monitors find their patient through the bed, and a CGM can too while its patient stays in one bed. An inpatient CGM sensor moves with its patient from the ward to imaging to step-down, though, so Kymolog can file its readings through the sensor's assignment to the patient instead. A nurse sets that assignment once, when the sensor goes on, and ends it when the sensor comes off.
Kymolog then files every glucose value in the patient's current encounter, beside the rest of the hospital record. A reading from a sensor with no current assignment waits for review, marked preliminary, until someone matches it to a patient.
CGM data for research
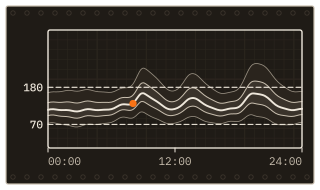
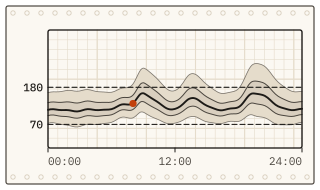
Kymolog keeps every CGM reading as its own coded record, at the sensor's own interval. Each record carries the value, unit and measurement time, the patient's encounter, and the sensor's unique device identifier (UDI) with its serial.
A CGM dataset built from those records answers the standard questions directly. Time in range, mean glucose, the standard deviation (SD), the coefficient of variation (CV) and the ambulatory glucose profile (AGP) are all arithmetic on the series. Our guide to glycemic variability and the AGP works through each one.
For CGM clinical trials, the UDI on every reading shows which sensor produced which value. When a study also needs the EHR's own data, such as A1C results, diagnoses and medications, we point teams to Clinical Extract.
Request a demo for your CGM program
Tell us where your patients wear CGM sensors and which EHR charts them. We reply within one business day with times to talk. In the demo, a day of sensor readings goes into a test chart and comes back out as dataset rows.